Making smarter cities
UI design ・ UX research ・ design ops
I started working on Habidatum+Mathrioshka urban analytics platform in mid’2016 and worked on it for a year.
Team
Design Director: Eduard Haiman
CTO: Vadim Smakhtin
Analytics Director: Ekaterina Serova
Development team: Nikita Pestrov, Alexei Pyzhyanov, Anton Vasin, Tim Tavlintsev, Nadya Klevakina, Galya Sarkisyan, and others.
My Role
At first, I was a single designer in a company and collaborated closely with development, management, and data science teams.
I designed and updated various interface components and flows using instruments at hand, sometimes working — literally — side-by-side with the developers, which helped us to iterate swiftly. My main tools were Sketch for mocking the designs, Principle for UI animations, and front-end stack (JS, Stylus, HTML, Git) for building hi-fi prototypes.
After two more designers joined the team, we re-created the design pipeline completely with Figma (yes, back in early 2017). In all these ventures I was the leading designer. My job was also to maintain the design library and share the knowledge with new designers in the team, which was one of the favorite parts.
Business Goals and Product Challenges
In the ever-changing market of urban analytics and big data, the brand new product made by a relatively small team should be well-designed and properly marketed to stand out from the "heavy-weight" competition. This task implies finding the right niche and doing a lot of UX and market research, adding tech perfection to the mix.
There were several pain points our team was trying to overcome:
- We needed to onboard first actual users for the Chronotope platform and start earning money;
- User testing process paired with basic product analytics needed to be established for the team to be able to measure the success of the app;
- The platform — a web app with an intricate high-load back-end needed a “face-lift” on the client-side, and in the dashboard;
- After our design team was expanded with two more designers working primarily on PCs a question of design continuity arose, along with the necessity to build a system of reusable cross-platform design components;
- Some client projects, mainly presentations created with Readymag, needed additional polishing and actualization that involved both visual and UX updates;
- A huge backlog of old tasks and irrelevant designs stored chaotically — .psd and .sketch files, or rogue raster images.
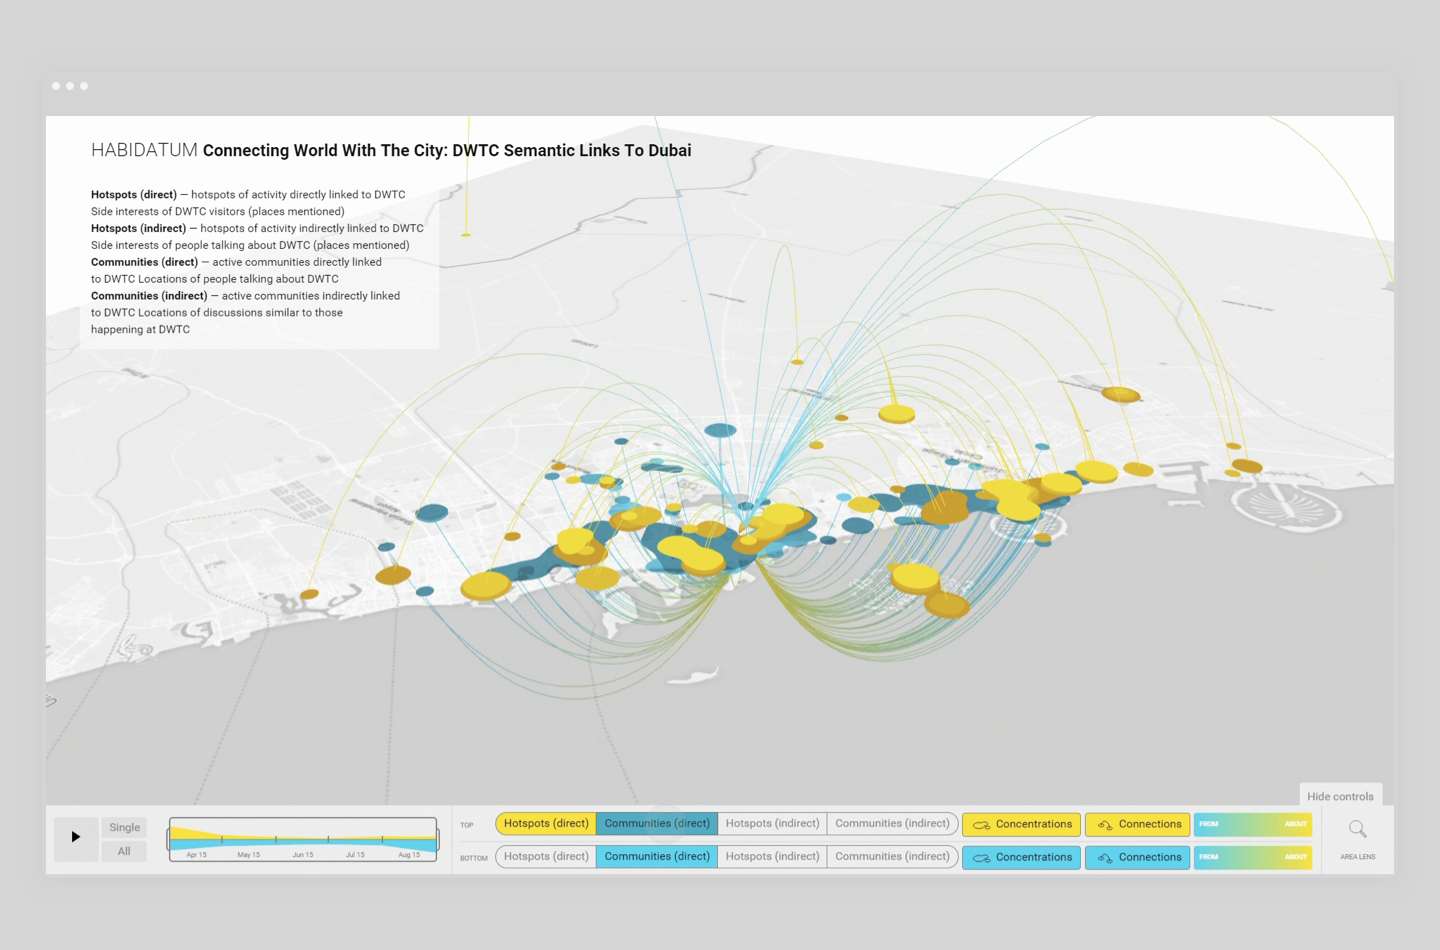
The Platform
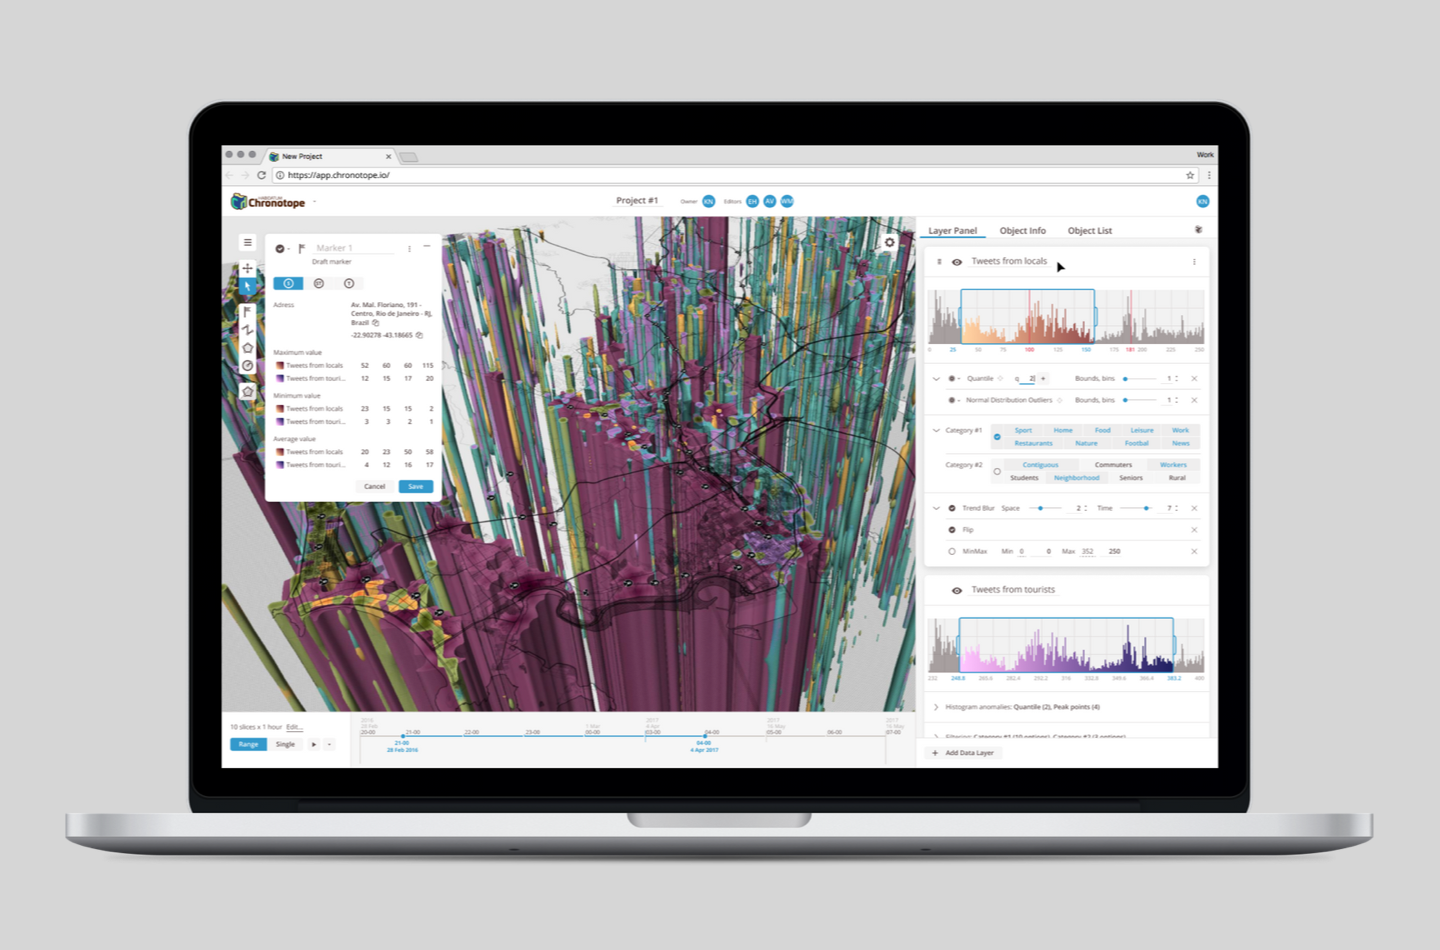
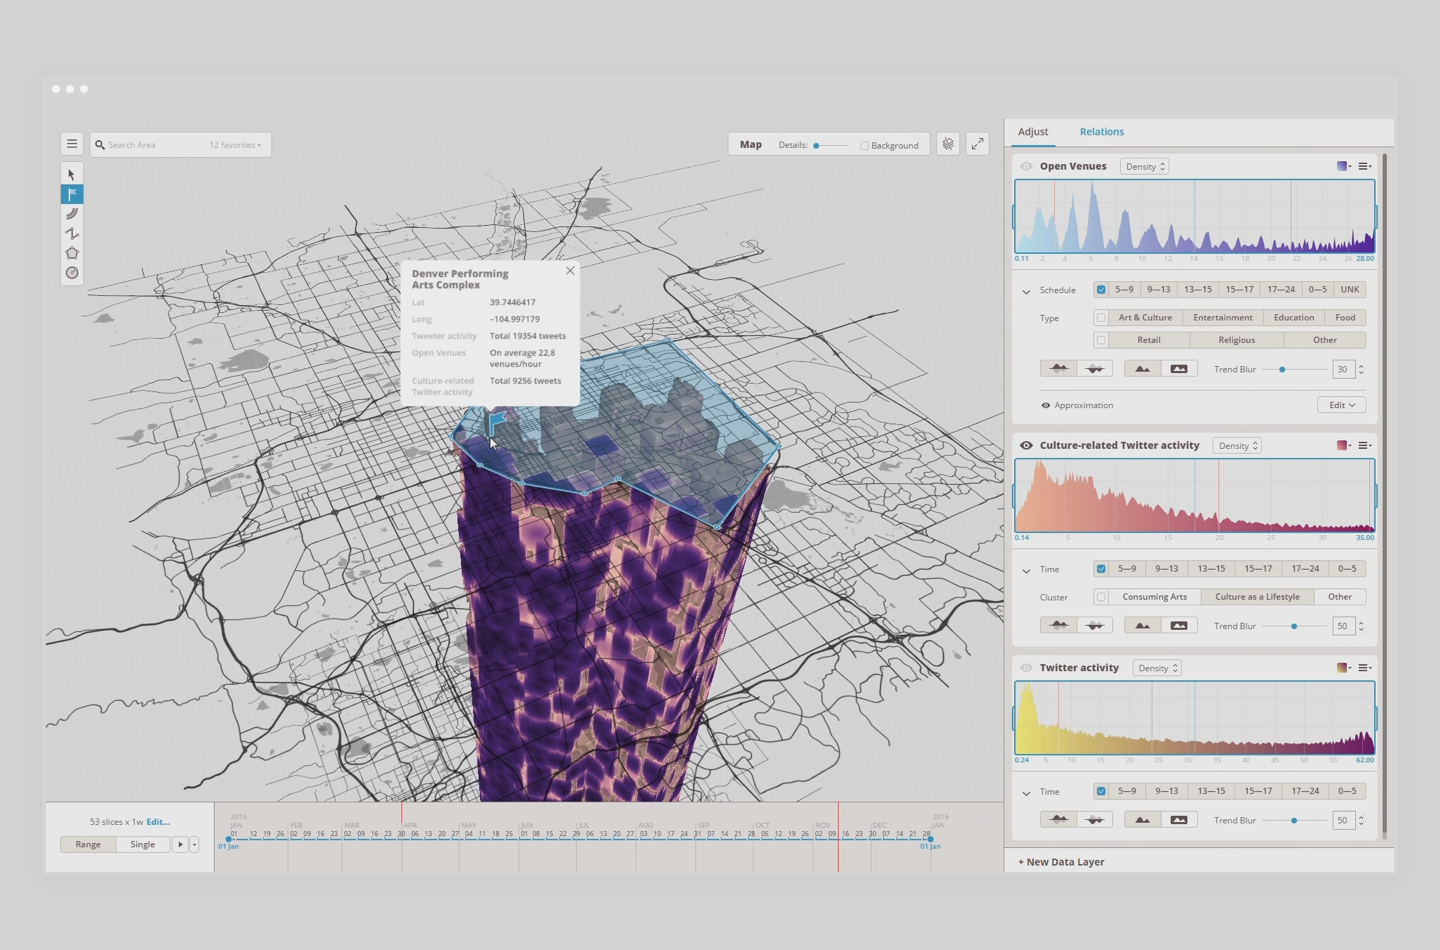
Speaking of our main asset: the Platform, we tried to achieve the transparency of urban data (collected either from open sources, like Swarm or Twitter, or from client custom-made datasets) for everyone — not only the urban experts. It included the interface updates making it more user-friendly, and the creation of a user knowledge base. One of the toughest problems here was to make the process of data upload and initial setup as easy as possible.
The Platform was split into four main blocks:
- Back-end and dashboard allowing the data upload and fine-tuning;
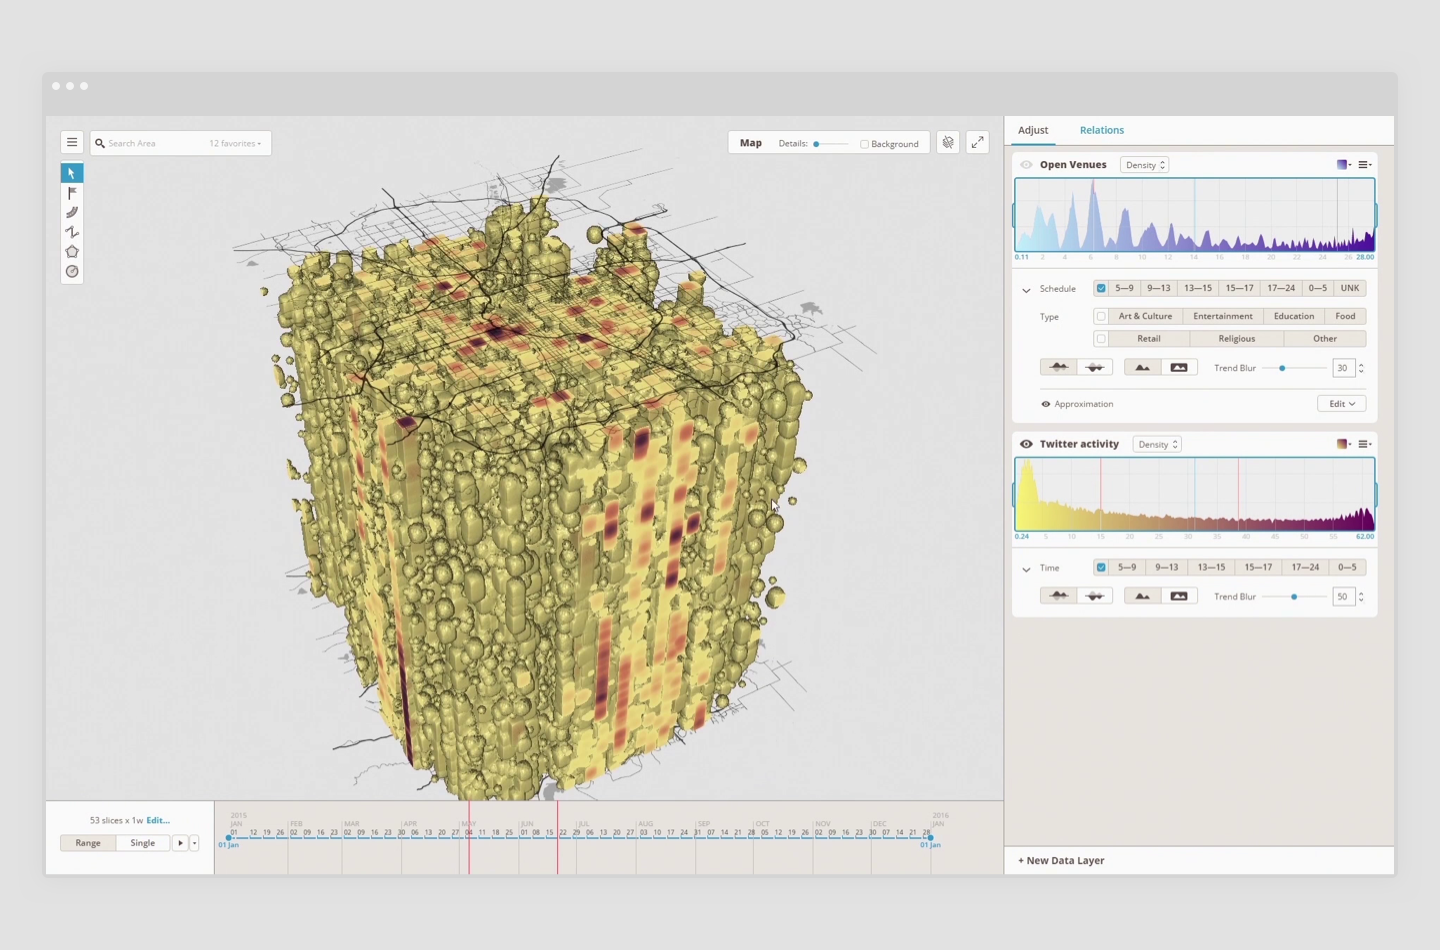
- Front-end part with a complex data visualization right in browser (this included the help and knowledge base interfaces);
- Customizable part allowing to build tailored instances of the Platform specifically for enterprise clients from “building” blocks;
- Platfrom landing page, allowing to subscribe to beta updates.
Design library
To facilitate the work of a cross-platform team we needed a totally new solution. I used Sketch and other designers relied mainly on Windows solutions such as Creative Cloud app stack. These apps were not up to the task of connecting two design worlds. I suggested using Figma as it was the best web-based solution at the time (still in beta, tho), and allowed us to work collaboratively on the same designs in real-time.
So, one of the first teams in Russia we started using Figma for day-to-day design tasks. This included building a component library, splitting all the existing designs into categories, and importing Sketch-made designs to Figma. The design process had a defined set of steps: experimentation and discussion, creating different states for a component, implementing it into a library — each step with its own workspace to make quasi-versioning easier.
UX research
We've started doing regular user interviews data scientists working on our team, and later — with data scientists, architects, and managers working on our potential clients' teams. This included the whole thing from writing the script to sitting next to a user and watching them traverse the particular scenario, analyzing the results (usually through a direct discussion), and then simplifying and adapting our interface if necessary.
Client projects
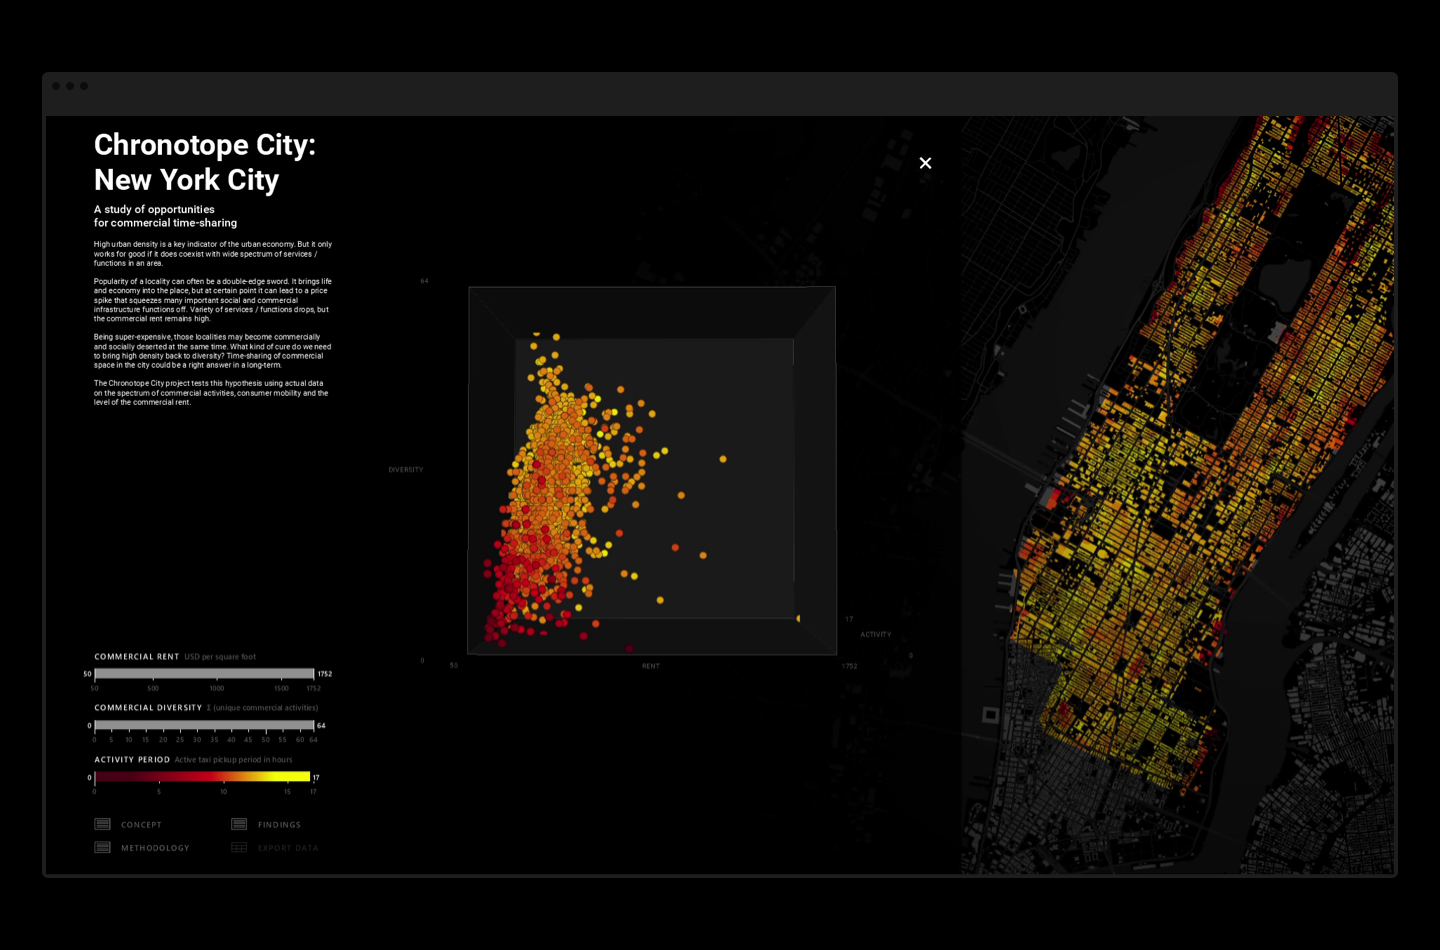
The main goal here was to create a visual style that can be reused for new client presentations. Older landing pages and interactive visualizations needed to be adapted for mobile platforms. Together with the front-end engineering team we optimized the performance and made all the animations in the interactive dataviz as smooth as possible.
The side-goal here was to build up a library of reusable components (plots, charts, media galleries, etc.) for our future landing pages and visualizations. Later on, most of them were added to our codebase. Also, we’ve experimented a lot with color schemes, font styling, and different controls to improve the usability on mobile platforms.
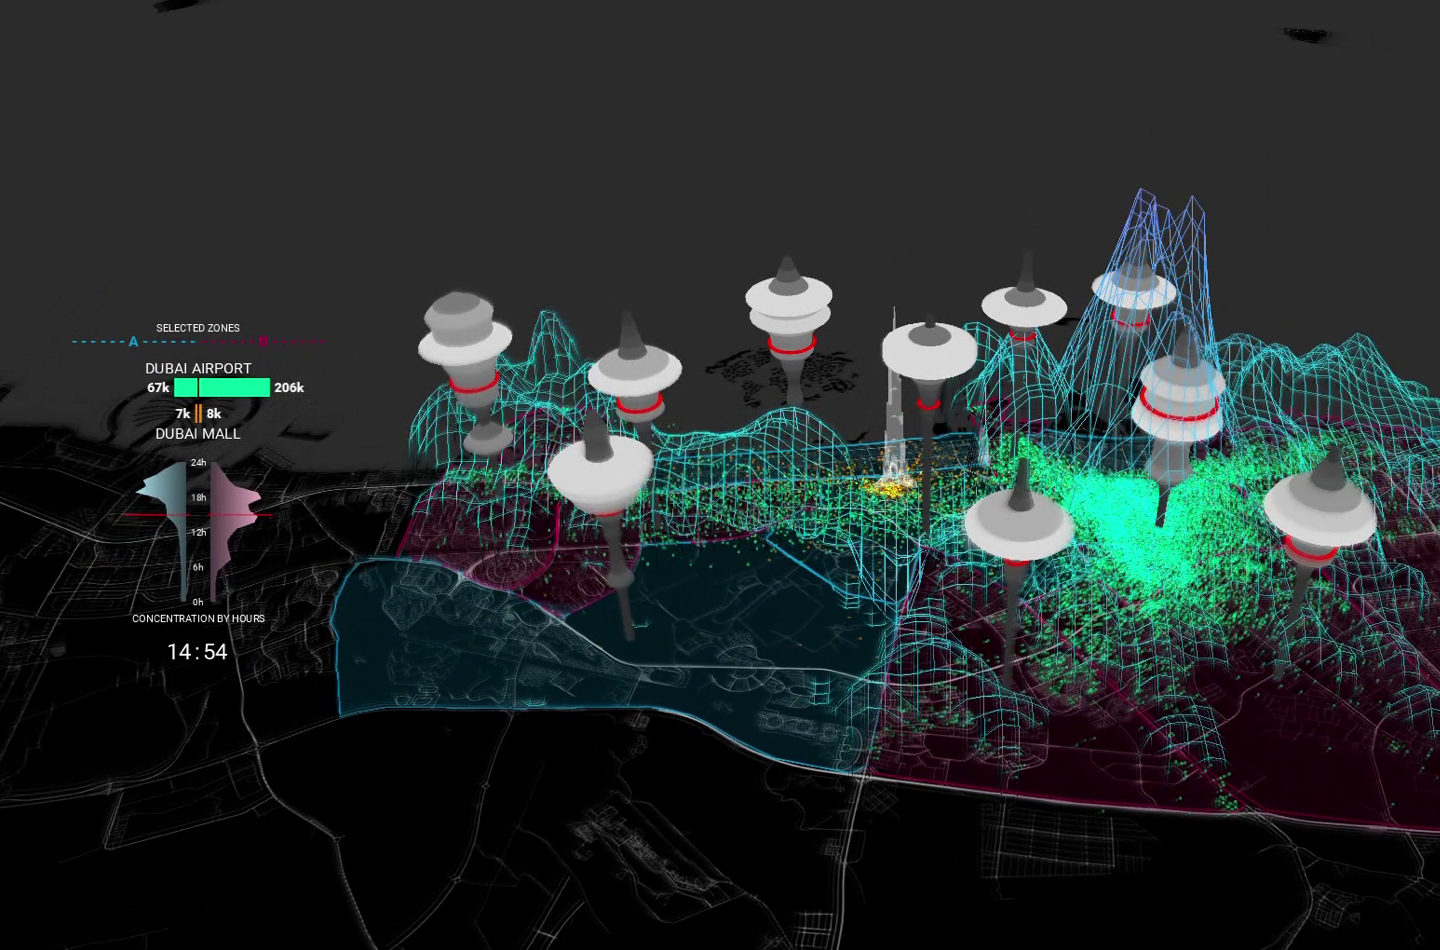
At some point, we’ve designed a special version of our platform with some additional widgets and tweaks to be used on-premise for one of our main clients. This lead to solving some challenging tasks: platform interfaces had to work nicely on multiple connected screens; some parts needed to be built from scratch or heavily adapted for mobile devices; all web interfaces also have to be optimized for real-time monitoring of huge datasets.
Results
- In less than a year we’ve updated the design of the Platform, so it was ready for a beta release;
- 20+ user interviews 🎙 were conducted;
- Onboarded first 5 enterprise clients;
- New design for Habidatum landing page was done;
- Design team created several mobile-optimized interactive data visualizations for clients;
- Tried out the new role of a design lead 🤯. Onboarded new designers;
- We’ve acquired the knowledge about the new tool — Figma — and built all our design processes around it;
- We gradually increased the “design awareness” among the teams of managers, analytics, and developers with a series of guest lectures and workshops about typography, building presentations, etc. 👩🏽🏫;
- Made a company booth at Smart City Expo in Dubai, and for Barcelona Expo.